A history of cycle tiling
Maps on the web
The history of tiling begins with the history of the online web apps, such as Open Street Map, which was founded by Steve Coast in 2004 and Google Maps which began life as Where 2 Technologies before being acquired by Google in 2005.
"Tiling" is so-called because the main web map apps use the word "tiles" to describe the pieces of map that get copied to your computer or phone and then stitched together to show you a map you can move and explore. Sometimes, when your internet connection is slow, you can detect the presence of these tiles because some parts of the map display well with lots of detail and others are blank - behind the scenes some tiles have downloaded but others haven't.
Every tile is 256-by-256 pixels in size but the amount of actual landmass shown depends on the zoom level. The biggest tile of them all is the zoom level 0 tile, a single tile covering almost the entire globe - for technical reasons the regions closest to the North and South Poles are not included. The zoom level 1 tiles are created by splitting the zoom level 0 tile into four equal parts - creating tiles in the north-west, south-west, north-east and south-east quarter-spheres. This splitting procedure continues to create zoom level 2 - each of the four level 1 tiles are split into 4, creating a total of 16 tiles. The mapping companies actually define levels all the way down to zoom level 20, where the tiles have been split so much that each tile represents only about 20m-by-20m of real land, depending on your latitude. The maps rarely show much detail at this extreme zoom level. Please see out How big is a tile? page for further calculations.
The first tile
In 2015 Ben Lowe, the founder of VeloViewer, realised that the zoom level 14 tiles, each about a mile wide, made a nice collection challenge. A typical ride might go through 20 to 50 tiles and because he was collected GPS data from Strava anyway, it was relatively easy to show which tiles had been visited. In March 2015 he added a feature to VeloViewer that tracked the number of unique zoom level 14 tiles that a rider had been to. Because zoom level 14 was the original zoom to be collected, 'zoom level 14 tiles' are often simply called tiles.
The max square
VeloViewer addicts quickly realised that there was fun to be had in trying visit all the tiles nearby. A German rider (unfortunately their name appears to be lost to history) told Ben that he was deliberately trying to get a big a "max square" of tiles as possible. I.e. visiting as many tiles in an NxN arrangement as possible. Ben quickly added this measurement, and a leaderboard, to VeloViewer. And the riders quickly tried to create the largest max square they could. By end of 2016, two Belgian riders, Nils Oudejans and Dominique had both created the first max squares bigger than 50x50. The first 100x100 was achieved by Jon France on New Year's Eve 2018 and at the time of writing Dead Balladur has the largest of them all, a 126x126 square that stretches from Paris to the Belgian border.
The max cluster
Whilst some were happy with the max square concept, others, particularly the Dutch with their diagonal coastline, didn't like it. Too often, a max square would reach its natural limit due to a sea or truly inaccessible areas such as active military sites. Initially calling it a clump, Pete Bartlett formally defined the concept of a 'tile cluster' - a tile is in a cluster if it has been visited and all its neighbours to the north, south, east and west have been visited too. A "max cluster" is simply the largest of a rider's clusters. They can form arbitary shapes and so are not limited by the 'impossible tile' problem. Max clusters were added to VeloViewer in 2017. Max clusters are naturally even bigger than the max square and can include multiple countries. Jürgen Knupe currently has the largest cluster of all, which stretches from the Baltic Sea all the way to the Mediterranean.
Single day rides and the global heatmap
As clusters and squares got bigger and bigger and further away from home, riders sought out new tiling challenges. Eric Nichols was the first to go for a "single ride max square" - 81 squares in a 9x9 all visited one ride and today RideEveryTile.com is tracking maximum single day tiling efforts in more than 20 countries. The global leader is Peter Lundgren who rode an incredible 25x25 zoom 14 square in a single day.
Riders were also keen to know if they were only one who had got to a particularly difficult tile and so the global heatmap, now visible on VeloViewer was born. These show that popular tiles, like that containing Box Hill may have been visited tens of thousands of times by tiles others, such as the Coryton Oil Refinery tile pair, have been visited just once.Other sites spring up
The initial growth of tiling outside of VeloViewer was in discussion forums such as the RideEveryTile Strava club (with many regional spinoffs: e.g France, Benelux and Japanese) and this never-ending YACF thread. but before too long VeloViewer's success encouraged others to emulate it more directly. Statshunters was launched by Stan Ansems in 2019 and calculates the same tile count, max square and max cluster as VeloViewer. In 2021, a group of Polish riders launched Squadrats. Like VeloViewer and Stathunters it tracks zoom level 14 tiles, but decided to also track zoom level 17 tiles too, calling them Squadratinhos. This presented a fresh challenge to those whose zoom 14 clusters were too big to be extended with a ride from home.
But why stop at only zooms 14 and 17?
Different zoom levels make sense for different riders. Zoom level 17 makes sense for those living in dense urban jungles with roads everywhere, but even zoom level 14 may be too sparse for a rider in a very rural location. In big tile areas like zoom 10 make sense if your goal is to fill in a whole country or even continent. This is why RideEveryTile allows you to upload rides and discover your tile count, max square and max cluster for EVERY zoom level from 0 to 17. If you already have an account, login or visit your athlete page to see your own scores, or the leaderboard page to see how you compare with others. If you don't have an account, sign up here
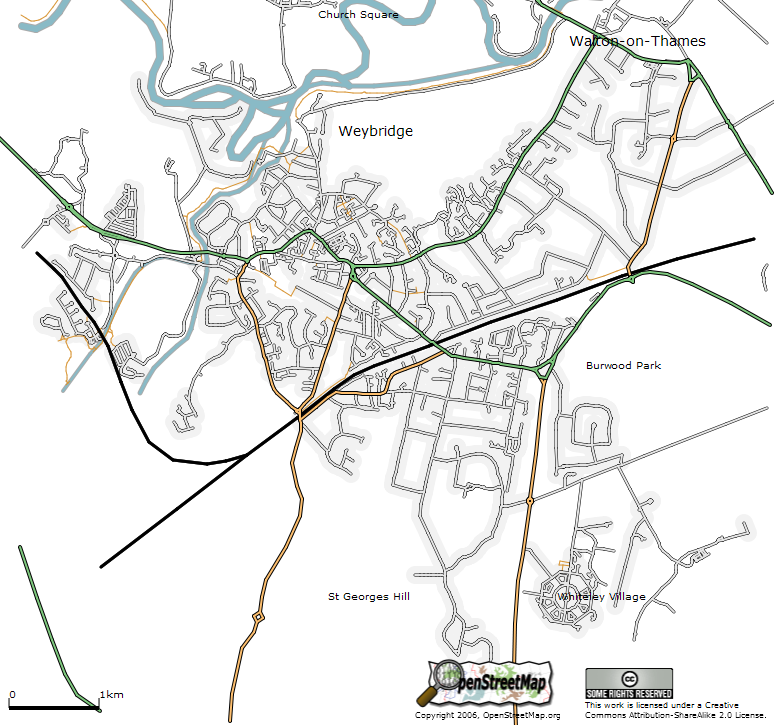
An early version of OpenStreetMap. (c) 2005 OpenStreetMap, Creative Commons Attribute-Sharealike 2.0 |
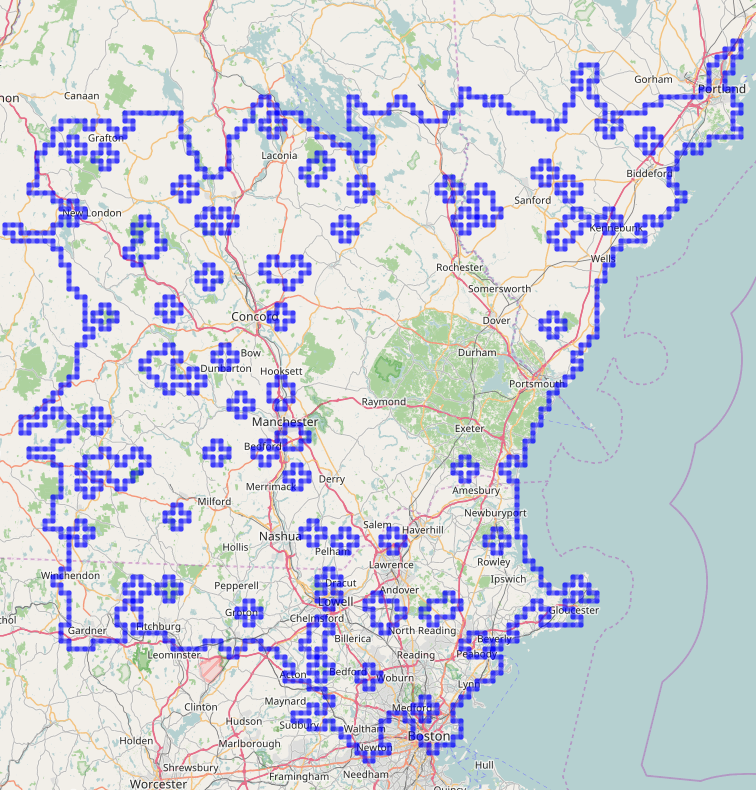
A prototype version of the tiling 'cluster', initially called a 'clump' |
Choose your challenge! Shown are Jon France's rides at zooms 10 through 17 |